Introduction ( Python tools for data analysis )
Data analysis is one of the most crucial tasks for data scientists, and Python is undoubtedly the most popular language for performing it. With its easy-to-read syntax and a vast array of libraries and tools, Python simplifies data analysis, from data cleaning and preprocessing to visualization and advanced statistical operations. In this article, we’ll explore 8 essential Python tools for data analysis that every data scientist should use. These tools help you manipulate, analyze, and visualize data efficiently, making your workflow faster and more productive.
By the end of this article, you’ll have a solid understanding of which tools to use for different aspects of data analysis, from managing large datasets to building complex visualizations.
Table of Contents
1. Pandas: Data Manipulation and Analysis
When it comes to data manipulation and analysis, Pandas is the go-to tool for Python developers. Pandas simplifies data handling by providing data structures like DataFrames and Series, making it easy to clean, filter, and analyze large datasets. Its powerful indexing and data alignment capabilities allow for efficient manipulation of structured data.
Key Features:
- DataFrame and Series objects for handling tabular and time-series data.
- Functions for filtering, aggregating, and reshaping datasets.
- Tools for reading and writing data from/to various formats like CSV, Excel, SQL, and JSON.
Example:

Pandas is essential for performing all kinds of data manipulation, from cleaning to complex operations like group-by and pivot tables.
2. NumPy: High-Performance Mathematical Operations
NumPy is a foundational library for numerical computing in Python and is widely used in data analysis for performing high-performance mathematical operations on arrays and matrices. It supports powerful n-dimensional arrays, broadcasting, and mathematical functions, making it the foundation for many other libraries, such as Pandas and SciPy.
Key Features:
- Support for multi-dimensional arrays.
- Functions for performing mathematical operations like linear algebra, statistics, and random number generation.
- Fast operations using vectorized computations.
Example:

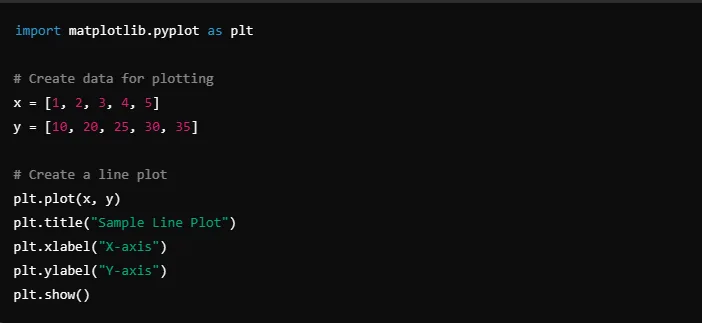
Matplotlib is perfect for creating professional-looking static plots and is often used for publishing scientific data and reports.
4. Seaborn: Statistical Data Visualization
Seaborn is built on top of Matplotlib and is designed for creating attractive and informative statistical graphics. It simplifies the process of creating complex visualizations, such as heatmaps and pair plots, and provides themes to enhance the visual appeal of your plots.
Key Features:
- High-level interface for creating attractive statistical plots.
- Built-in themes and color palettes.
- Tools for visualizing distributions, relationships, and categorical data.
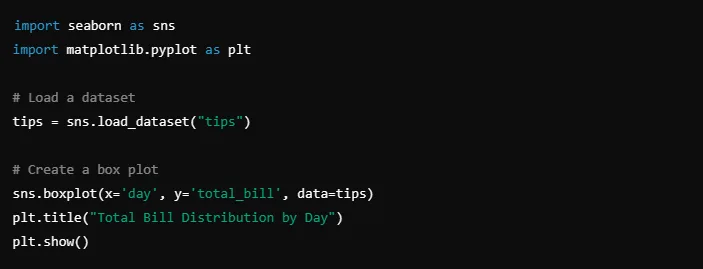
Example:

Seaborn is perfect for creating aesthetically pleasing visualizations with minimal code, especially for statistical data.
5. SciPy: Advanced Scientific and Statistical Computing
SciPy builds on NumPy and adds functionality for advanced mathematical and statistical computations. It is widely used for scientific research, providing tools for optimization, integration, interpolation, and signal processing. If your data analysis tasks involve more advanced computations, SciPy is the library to use.
Key Features:
- Functions for optimization, integration, and interpolation.
- Statistical functions for working with probability distributions and hypothesis testing.
- Modules for linear algebra, Fourier transforms, and signal processing.

SciPy is the go-to library for performing advanced scientific and statistical operations, making it a must-have tool for data scientists.
6. Plotly: Interactive Data Visualizations
Plotly is a library that allows you to create interactive web-based visualizations. Unlike Matplotlib and Seaborn, which produce static plots, Plotly’s graphs can be zoomed, panned, and hovered over for detailed analysis, making it ideal for dashboards and web applications.
Key Features:
- Create interactive plots that can be embedded in web applications.
- Support for 3D plots and maps.
- Works with both static and real-time data.
Example:

Plotly is perfect for creating dynamic visualizations that allow users to interact with the data, making it ideal for data storytelling.
7. TensorFlow: Data Analysis for Machine Learning
While primarily known for its machine learning capabilities, TensorFlow also plays a significant role in data analysis. TensorFlow provides tools for managing large datasets, preprocessing data, and building complex models that can analyze and make predictions from the data.
Key Features:
- Large-scale machine learning with support for deep learning models.
- Tools for data preprocessing and manipulation.
- Works efficiently with GPUs and TPUs for high-performance computing.
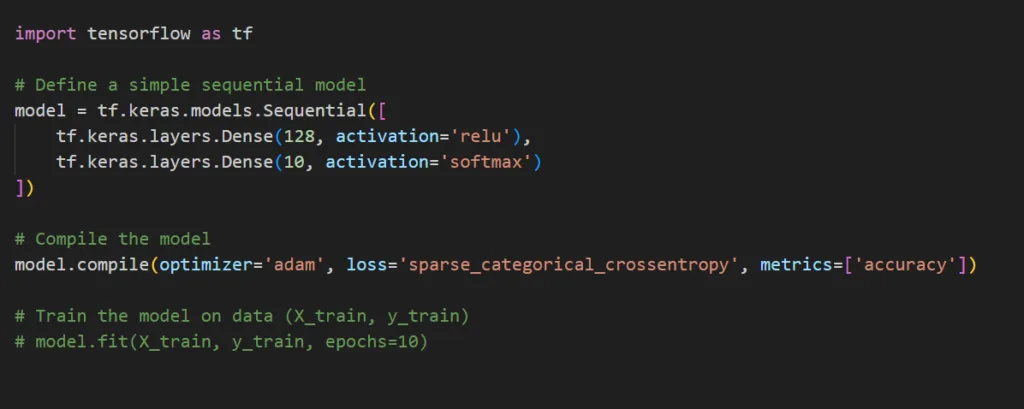
Example:

TensorFlow is indispensable for data scientists working on machine learning projects that require large-scale data processing and predictive analysis.
8. Dask: Handling Big Data in Python
As datasets grow larger, it becomes increasingly difficult to manage them in memory. Dask provides parallel computing capabilities, enabling data scientists to work with larger-than-memory datasets and distribute computation across multiple cores or machines.
Key Features:
- Handles datasets larger than memory.
- Integrates seamlessly with NumPy and Pandas.
- Supports parallel processing for distributed computing.
Example:

Dask is the best choice for data scientists dealing with big data, providing an efficient way to scale computations across large datasets.
Conclusion
Mastering these 8 essential Python tools for data analysis will give you the ability to handle every aspect of the data analysis pipeline, from data cleaning and manipulation to advanced visualizations and machine learning. Whether you’re a beginner or an experienced data scientist, these tools will help you work more efficiently and unlock new insights from your data.
By incorporating these tools into your data analysis workflow, you can take full advantage of Python’s versatility and power, making your data science projects more effective and impactful.
